Did you ever wonder why the spectrum display noise floor changes when you adjust spectrum display width on your SDR? Keep reading for the answer.
When you narrow your spectrum display width, something interesting happens. First, the measurement of the signal stays the same. Second, the measurement of the noise floor decreases. Why does this happen?
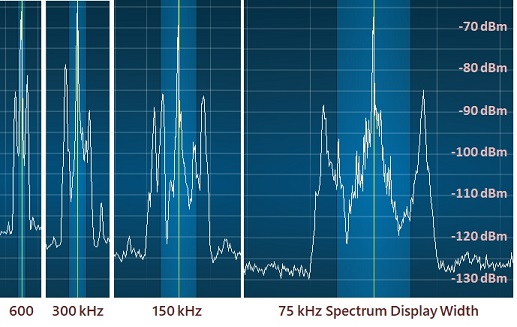
In the above picture, you can see four snapshots of the Radio Saudi signal on 13710 kHz one morning at 1700 UTC. On my Flex 6300, this signal is S9+10, or -67 dBm. When I narrow the spectrum display width from 600 kHz down to 75 kHz you can see three things:
- The displayed width of the signal (carrier plus double sideband modulation) increases. This makes sense because the 10 kHz signal occupies more of the screen when you zoom in.
- The peak signal strength of the carrier stays constant. This makes sense, also, as the signal strength should not be effected by the span of the spectral display. -67 dBm all the way.
- But, did you also notice that the level of the surrounding noise floor drops by 3 dB each time we cut the display bandwidth in half? Huh? What is the real noise floor?
In short, the spectrum display noise floor level depends on bandwidth. That’s because noise is a wideband power spectrum. When you narrow the Fourier Transform, less noise makes it into the picture. But the signal remains the same.
Spectrum Display Noise Floor – Here’s the Math
Reduction in the displayed noise floor comes from the addition of FFT processing gain. Processing gain is created according to the formula PG = 10 log(M/2) where M is the number of bins in your FFT. But, looked at another way, it’s really all about the width of each bin (or filter) in the FFT. So, if you are sampling a 600 kHz spectrum with an 8192 point FFT, the width of each bin is 600,000 ÷ 8192 = 73 Hz and processing gain is 10 Log(8192/2) = 36 dB.
You have two ways to reduce FFT bin width. First, you can reduce the sampling bandwidth, which is what we did in the example above. For example, decreasing bandwidth from 600 to 300 kHz provides processing gain of 10 Log(600/300) = 3 dB. Second, you can increase the length of the FFT. For example, increasing M from 8192 to 16,384 produces processing gain of 39 dB, a 3 dB increase.
Your SDR typically uses either or both of these approaches.